Overview:
The definition of biologically meaningful management units has become an important topic in natural resources management. The most commonly identified management unit has become the watershed.
A single watershed is a part of the landscape, which drains through a common drainage outlet. All precipitation which falls on a watershed will drain out through this common outlet. A watershed, thus, is defined by its outlet. For example, the Snake River Watershed is defined as the area which drains through a point just upstream of the confluence of the Snake and Columbia Rivers.
Grid provides a set of tools to make watershed delineation quite simple, assuming you get all the steps in the correct order and know a few "tricks." The basic steps are:
The first step in watershed delineation is the filling of sinks:
Usage: FILL <in_grid> <out_grid> {SINK | PEAK} {z_limit} {out_dir_grid}
You can optionally fill sinks (default) or chop off peaks. The {z_limit} allows you to limit the depth of sinks to be filled or the height of peaks to be cut. You can also specify an optional output flowdirection grid.
Grid: fill dem demfill
Filling...
Number of sink(s): 219
Number of sink(s): 39
Number of sink(s): 5
Number of sink(s): -1
Direction of flow is calculated in a 3 x 3 cell neighborhood. For the central cell, every one of the 8 adjacent cells is tested for horizontal distance and elevation difference. The direction of the neighboring cell with the greatest downward descent is chosen for the value of the center cell. The directions are assigned according to this 7-bit matrix:
|
|
|
|
| |
|
|
|
So when a cell flows to the southwest, its flowdirection value is 8.
Usage: FLOWDIRECTION (<surface_grid>, {o_drop_grid},
{NORMAL | FORCE})
You can optionally create a {o_drop_grid}, which, "(f)or adjacent cells, ... is analogous to the percent slope between cells. Across a flat area, the distance becomes the distance to the nearest cell of lower elevation. The result is a map of percent rise in the path of steepest descent from each cell." The {NORMAL | FORCE} option will either cause edge cells to flow as though there were no edge (default), or will force edge cells to flow off the edge of the grid (FORCE).
Grid: flowdir = flowdirection (demfill)
Once direction of flow for each cell is known, then a flow accumulation network can be created. This is in essence like placing a marble on each cell and letting all the marbles roll downhill. Imagine a flow gauge at each cell, counting the number of marbles passing through that cell. The number of marbles passing through that cell is the flow accumulation.
Usage: (F) FLOWACCUMULATION (<dir_grid>, {weight_grid})
FLOWACCUMULATION should always be performed on a flowdirection grid that has been created with the FLOWDIRECTION function, otherwise it can go into an infinite loop and never stop processing. An optional {weight_grid} can be applied, which uses the values from another grid rather than the default value of 1 per cell, and accumulates this flow.
Grid: flowacc = flowaccumulation (flowdir)
There are a few extra steps to take in defining flow accumulations. First, we need to create a hydrologically correct stream network in order to select pour points. To do this, we should try several different flow accumulation values, and see what "looks" best.
Grid: mapextent dem
Grid: gridpa dem # linear nowrap gray
Grid: $$display = con (flowacc gt 100, 4)
Grid: arcl str2 3
looks a little too dense
Grid: gridpa dem # linear nowrap gray
Grid: $$display = con (flowacc gt 500, 4)
Grid: arcl str2 3
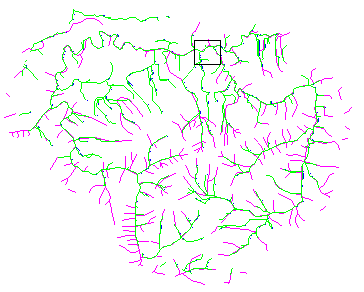
looks a little better, but I really want the flowaccumulation-generated streams to look similar in extent to the mapped streams, so I know I'm selecting a path with a high amount of flow volume. Let's zoom in a bit and take a closer look
Grid: mape 1185458 554872 1190607 560324
Grid: $$display = con (flowacc gt 1000, 4)
Grid: arcl str2 3
let's try one more
Grid: $$display = con (flowacc gt 5000, 4)
Grid: arcl str2 3
OK. If this does not work, we can still do it over
Grid: flow5000 = con (flowacc gt 5000, 1)
Grid: stream5000 = streamline (flow5000, flowdir)
Now we have a grid network representing high flow paths and also a line coverage representing the same data.
Pour points will be digitized using the ArcEdit module. In essence, ArcEdit is the most common module used to bring coordinate data into ARC/INFO. ArcEdit is complex, but we will be using some very basic functionality, so we do not need any major introductions.
Grid: arc ae	/* starts ArcEdit
Arcedit: create pour_pts stream500	/* create a new coverage, based on existing tics & boundary
Arcedit: image flow5000 transparent 4	/* draw the grid in the background
Arcedit: bc str2 6	/* draw the "real" streams in the background
Arcedit: bc stream5000 3	/* draw the derived stream net in the background
Arcedit: be arc	/* set what background features to draw
Arcedit: de point	/* set the foreground features to draw
Arcedit: sds 2	/* selected features in red
Arcedit: draw
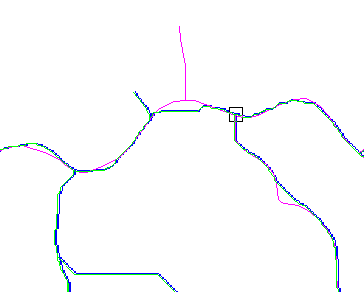
This is what you will see when you draw. Zoom in closer with a zoom window (zoom to the box shown in the above image), and you will see the actual data sets (flow5000 in blue, stream5000 in cyan, and str2 in purple):
Arcedit: ef point
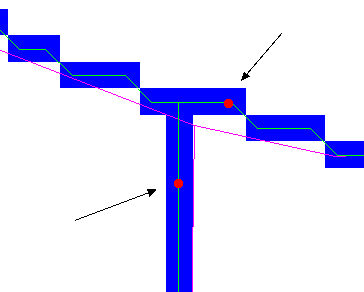
Before you add any points, zoom in even closer. I've added points along high-flow paths, but far enough away from each other so as not to affect the SNAPPOUR function. The points are added where indicated by the arrows.
Arcedit: add
Once you have added the points you want, quit and save.
Arcedit: q
Keep all edit changes (Y/N) : y
This will replace all changes back into the original coverage(s) and/or INFO file(s)
Do you really want to do this (Y/N) : y
Saving changes for E:\ARC_LMS\POUR_PTS
Saving labels...
4 label(s) written to E:\ARC_LMS\POUR_PTS
  from the original 0, 2 added and 0 deleted
   BND replaced into E:\ARC_LMS\POUR_PTS
Leaving ARCEDIT...
Now that we have pour points, we can create watersheds.
To create watersheds, we need a grid of pour points and a flowdirection grid. We already have the flowdirection grid, and we can create the pour point grid on the fly by embedding the POINTGRID function within the WATERSHED function. We will also use the SNAPPOUR function to make sure that the pour points are actually on high-flow cells.
Grid: setcell dem
Grid: sheds = watershed (flowdir, snappour (pointgrid (pour_pts), flow5000, 10))
Grid: gridsh sheds
Grid: arclines stream5000 3
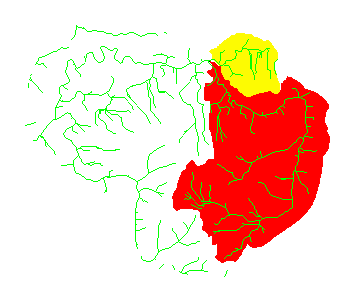
Once you have created watersheds, take a look at them. If they do not look correct, it is most likely because of poor pour point placement. Kill the watershed grid, start ArcEdit again, and edit the pour points. Then rebuild the watersheds grid. Once you have watersheds delineated, you can perform any of the other typical analyses we've already seen, such as road and stream densities, summary of forest stands, etc. on a watershed-by-watershed basis.
Slope and aspect are easily calculated in Grid.
The build-in SLOPE function calculate slope in either degrees (default) or percent.
Usage:  (F) SLOPE (<grid>, {DEGREE | PERCENTRISE})
        (F) SLOPE (<grid>, <z_factor> {DEGREE | PERCENTRISE})
The output grid will consist of values which represent the slope of a plane tangent to the input grid at each lattice mesh point. You can specify a <z_factor> which will multiply a constant to the cell values in the output grid.
Once you have a slope grid, you may classify it as you wish to create another grid. If you want to create a classified slope grid, first create a slope grid and then classify the output:
Grid: slp = slope (dem, percentrise)
Grid: slp50 = con (slp ge 0 and slp lt 50, 1, 2)
rather than placing the SLOPE function within the conditional:
Grid: slp50 = con(slope (dem, percentrise) ge 0 and slope (dem, percentrise) lt 50, 1, 2)
Although the latter will work, it causes the Grid processor to calculate slope twice rather than once. This may not make a difference in a 2-class output, but it will certainly make a difference in a multi-class output. The same rule holds especially true for any of the Grid functions that are processor-intensive.
Creating a grid of aspect is just as easy.
Usage: (F) ASPECT (<grid>)
The aspect grid will have values equal to the compass direction of the steepest line on a plane tangent to each lattice mesh point.
Grid: asp = aspect (dem)
Although aspect is easy for the user, it is processor-intensive, so the above rule about efficient use of processor time also holds true.
The only tricky part of using aspect is in generating zonal means. Because aspect values are not absolute, the means cannot be calculated using an arithmetic mean. We will perform this task next week.
It is possible to create a series of surface grids from a single function: CURVATURE.
Usage:  (F) CURVATURE (<grid>,  {o_pro_curv}, {o_plan_curv},
                       {o_slope}, {o_aspect})
The default output from the CURVATURE function is a grid representing the shape of the grid at each mesh point. "A positive curvature indicates that the surface is upwardly convex at that cell. A negative curvature indicates that the surface is upwardly concave at that cell. A value of zero indicates that the surface is flat." In addition to the slope curvature output, you can also create optional outputs of profile curvature, planform curvature, slope (in degrees), and aspect.
Based on the digital elevation model of Pack Forest, create watersheds at the confluences of streams which have contributing areas of at least 100,000,000 m^2 (flowaccumulation = 100,000).
What is the area of each watershed?
What is the road and stream density within each of these watersheds?
What is the timber age distribution within each watershed?